IC Design Industry Ranking
2017 Worldwide Fabless IC Design Leaders
|
2017 Ranking |
Company |
2017 Revenue (USD million) |
|---|---|---|
|
1 |
Qualcomm |
17,082 |
|
2 |
Broadcom Ltd. |
16,176 |
|
3 |
Nvidia |
9,402 |
|
4 |
Media Tek |
7,838 |
|
5 |
Apple |
6,960 |
|
6 |
AMD |
5,329 |
|
7 |
HiSilicon |
4,715 |
|
8 |
Xinlinx |
2,475 |
|
9 |
Marvell |
2,394 |
|
10 |
Unigroup |
2,050 |
Source:IC Insights, III-IEK, organized by SIPO (July 2018)
2017 Taiwan Fabless IC Design Leaders
|
Company |
2017 Revenue (NT$100 million) |
|---|---|
|
Media Tek |
2,382 |
|
Novatek |
471 |
|
Phison |
419 |
|
Realtek |
417 |
|
Himax |
208 |
|
Silicon Motion |
159 |
|
GUC |
122 |
|
Focal Tech |
108 |
|
ESMT |
105 |
|
Sitronix |
94 |
Source:Companies’ Financial Statements, III-IEK, organized by SIPO (July 2018)
IC Foundry Industry Ranking
2017 Worldwide IC Foundry Leaders
|
2017 Ranking |
Company |
2017 Revenue (USD million) |
|---|---|---|
|
1 |
TSMC |
|
|
2 |
Global Foundries |
|
|
3 |
UMC |
|
|
4 |
SMIC |
|
|
5 |
Powerchip |
|
|
6 |
Huahong group |
|
|
7 |
Tower Jazz |
|
|
8 |
VIS |
|
|
9 |
Dongbu HiTek |
|
|
10 |
X-Fab |
Source:IC Insights, III-IEK, organized by SIPO (July 2018)
2017 Taiwan IC Foundry Leaders
|
Company |
2017 Consolidated Revenue (NT$100 million) |
|---|---|
|
TSMC |
9,774 |
|
UMS |
1,493 |
|
Powerchip |
463 |
|
VIS |
249 |
|
WIN Semiconductors |
171 |
|
Liteon-semi |
115 |
|
EPISIL |
53 |
|
AWSC |
17 |
|
Mosel |
16 |
Source:Companies’ Financial Statements, III-IEK, organized by SIPO (July 2018)
2017 Worldwide Memory Leaders
|
2017 Ranking |
Company |
2017 Revenue (USD million) |
|---|---|---|
|
1 |
Samsung Electronics |
529 |
|
2 |
SK Hynix |
264 |
|
3 |
Micron Technology |
234 |
|
4 |
Toshiba |
97 |
|
5 |
Western Digital / San Disk |
78 |
|
6 |
Intel |
23 |
|
7 |
Nanya |
18 |
|
8 |
Winbond |
14 |
|
9 |
Macronix |
8 |
|
10 |
Cypress Semiconductor |
5 |
Source:IC Insights, III-IEK, organized by SIPO (July 2018)
2017 Taiwan Memory Leaders
|
Company |
2017 Consolidated Revenue (NT$100 million) |
|---|---|
|
Nanya |
549 |
|
Winbond |
476 |
|
Macronix |
342 |
Source:Companies’ Financial Statements, III-IEK, organized by SIPO (July 2018)
IC Packaging and Testing Industry Ranking
2017 Worldwide IC Packaging & Testing Leaders
|
2017 Ranking |
Company |
2017 Revenue (USD 100 million) |
|---|---|---|
|
1 |
ASE |
50 |
|
2 |
Amkor |
42 |
|
3 |
JECT |
35 |
|
4 |
SPIL |
27 |
|
5 |
PTI |
20 |
|
6 |
TSHT |
10 |
|
7 |
TFME |
10 |
|
8 |
UTAC |
9 |
|
9 |
KYEC |
6 |
|
10 |
Chipbond |
6 |
Source:IC Insights, III-IEK, organized by SIPO (July 2018)
2017 Taiwan IC Packaging & Testing Leaders
|
Company |
2017 Consolidated Revenue (NT$100 million) |
|---|---|
|
ASE |
1,524 |
|
SPIL |
836 |
|
PTI |
596 |
|
KYEC |
197 |
|
Chipbond |
184 |
|
ChipMOS |
179 |
|
OSE |
139 |
|
Walton |
94 |
|
FATC |
79 |
|
Ardentec |
79 |
Source:Companies’ Financial Statements, III-IEK, organized by SIPO (July 2018)
Semiconductor Industry Status Quo
In 2017, the global semiconductor market reached USD 412.2 billion with a growth of 21.6%. It is expected to reach USD 463.4 billion in 2018 with a continuous growth of 12.4%.
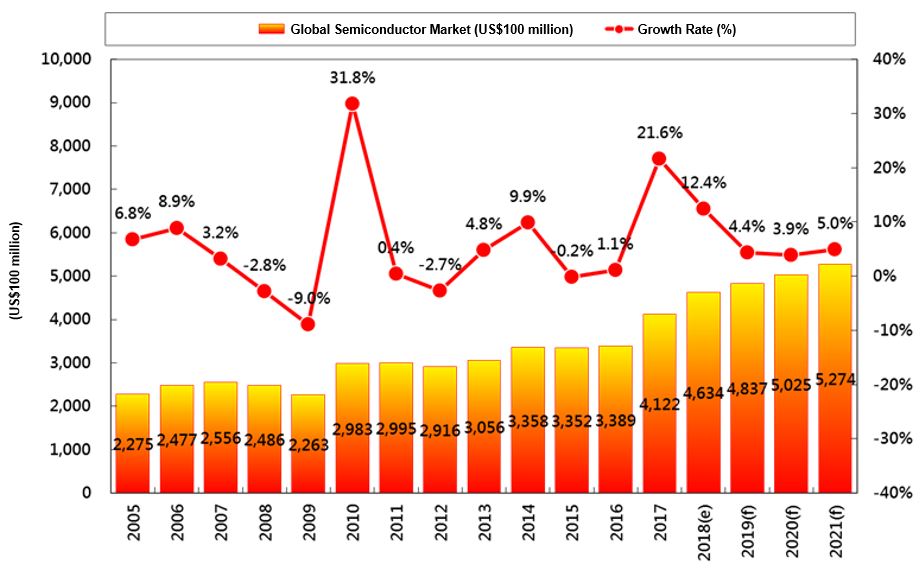
Source:WSTS, ITRI-ISTI, organized by SIPO (August 2018)
Global Significance of Taiwan’s Semiconductor Industry in 2017.
The world’s No. 3 player in terms of total IC Industry output
(IC Design No.2; IC Foundry No.1; IC Packaging and Testing No.1)
|
2017 |
Output of Taiwan (US$100 Million) |
Global Output (US$100 Million) |
Taiwan’s Market Share (%) |
Taiwan’s Ranking |
Major Taiwanese Companies |
Leading Countries |
|---|---|---|---|---|---|---|
|
Output Value of IC Industry Chain =A+B+C |
810 |
5,026 |
16.1% |
No.3 |
TSMC |
The U.S. and Korea |
|
A.IC Design |
203 |
976 |
20.8% |
No.2 |
Media Tek |
The U.S. |
|
B.IDM(include Memory) |
53 |
3,277 |
1.6% |
No.5 |
Nanva Technology |
The U.S., Korea, Japan and Europe |
|
C.IC Foundry |
397 |
547 |
72.5% |
No.1 |
TSMC |
Taiwan |
|
D.IC Packaging and Testing |
157 |
281 |
55.9% |
No.1 |
ASE |
Taiwan |
|
Output Value of IC products ( IC Brand)=A+B |
256 |
4,203 |
6.1% |
No.4 |
Media Tek |
The U.S., Korea, and Japan |
-
Taiwan’s IC industry has a complete industry chain. From the upstream IC Design to the downstream IDM and IC Packaging and Testing, Taiwan has a unrivaled and professional division-of-labor structure. The output value of Taiwan’s IC industry is in the world’s third place, right after the United States and Korea (before Japan, Europe, mainland China and Singapore).
-
The world’s No. 2 player in terms of total IC Design output, right after the U.S. (before Mainland China).
-
The world’s No. 5 player in terms of total IDM output and the world’s No. 4 player in terms of total memory production output. Taiwan mainly produces DRAM, and then NOR Flash and Mask ROM. Its world position comes only after Korea, the United States and Japan.
-
The world’s No. 1 player in terms of total IC foundry output and a global leader with advanced below 10 nm production process.
-
The world’s No. 1 player in terms of IC Packaging and Testing output. Besides, among the world’s top 10 professional IC Packaging and Testing companies, more than half of them are from Taiwan.
Source:WSTS, ITRI-ISTI, organized by SIPO (August 2018)
Taiwan value the development of the semiconductor industry as it facilitates the country’s economic growth and social development.
The industry’s output value is expected to reach NTD 3 trillion by 2021.
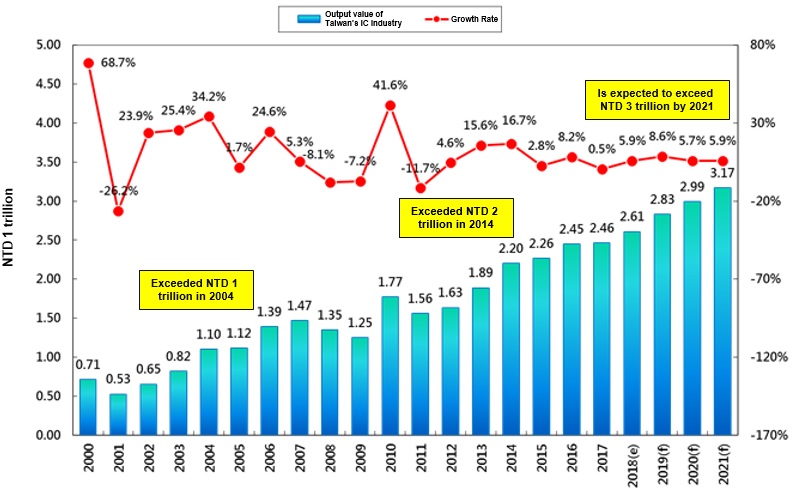
-
The output value of Taiwan’s semiconductor industry reached 2.46 trillion in 2017 with a growth of 0.5%. It is expected to reach 2.61 trillion by 2018 with a growth of 5.9%.
-
Taiwan’s IC industry has a complete industry chain. From the upstream IC Design to the downstream IDM and IC Packaging and Testing, Taiwan has a unrivaled and professional division-of-labor structure. The output value of Taiwan’s IC industry is in the world’s third place(about 20% of the market share), right after the United States and Korea.
-
The world’s No. 2 player in terms of total IC Design output (about 20% of the market share). The world’s No. 1 player in terms of total IC foundry output (about 70% of the market share). The world’s No. 1 player in terms of IC Packaging and Testing output (about 50% of the market share). The world’s No. 1 player in terms of Memory output (about 10% of the market share).
Source:TSIA, ITRI-ISTI, organized by SIPO (August 2018)
The Output Structure of Taiwan’s Semiconductor Industry.
In 2018, the proportion of IC Foundry is 48%, which has facilitated the development of IC Design (25%), IC Packaging and Testing (19%) and Memory industry (8%).
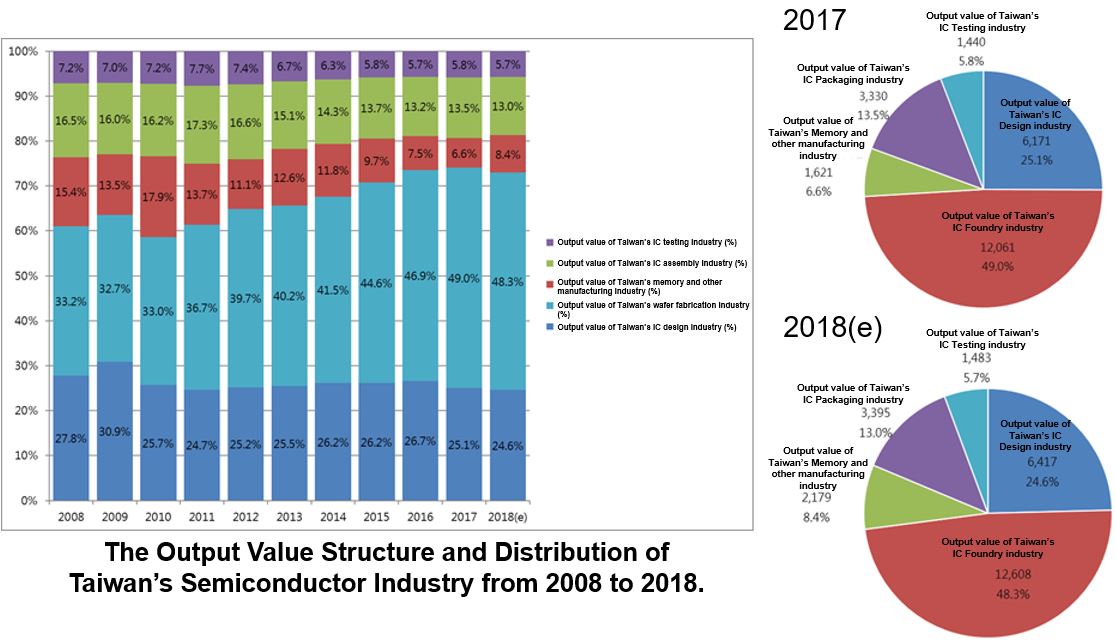
Source:TSIA, ITRI-ISTI, organized by SIPO (August 2018)
Smart Car Electronics Industry Status Quo
2017 Taiwan's automotive electronics output value grows year by year
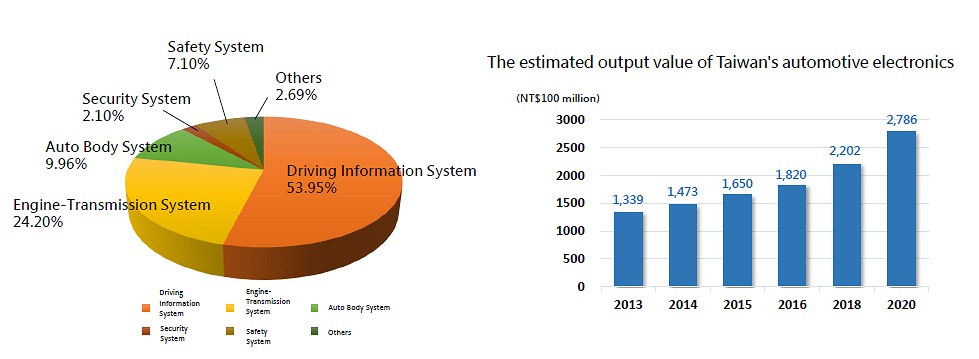
- In 2017, the output value of Taiwan's automotive electronics is expected to reach NT$208 billion, and by 2020 it will exceed NT$270 billion, which is equivalent to the output value of motor vehicles in Taiwan.
- Autonomous car and intelligent connected vehicles will promote the demand for products such as Advanced Driver Assistance Systems such as vehicle imaging systems, blind spot detection, lane departure warning systems, parking aid systems, and automotive LEDs.
Source:TEEMA, ITRI-IEK, organized by SIPO (July 2018)
Smart Medical Electronics Industry Status Quo
The accumulation of technological energy and the development of innovative service applications for smart healthcare
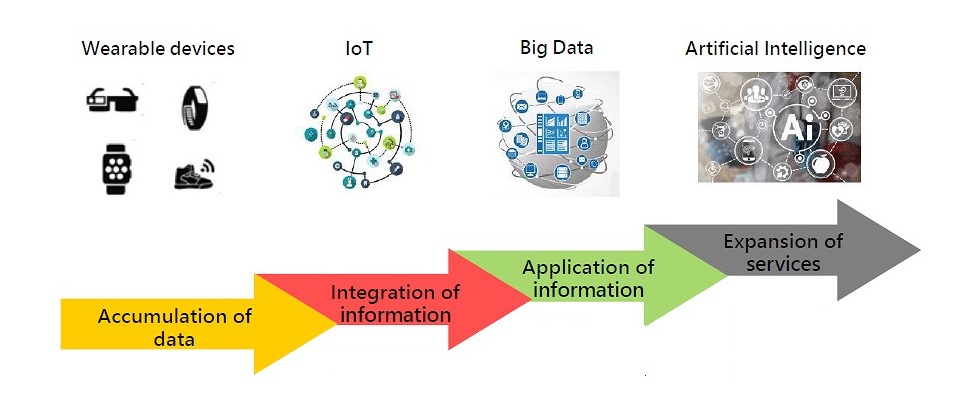
Accumulation of data:Integrating different seneing technologies and cooperating with relevant delvice designs in order to accumulate relevant physiological date and record living habits.
Integration of information:Using communication technologies to Link and integrate personal physiological information, past medical history. family medical history, genetic decryption, life style and other data into the platform system for storage, recording and tracking.
Application of information:Grasping analyzing, and interpreting data to identify relevant application and link to relevant healthcare applications.
Expansion of severices:Using artifical intellgence for literature learning, image interpretation, medical case analysis, and assisting medical staff as decision-making tools for disease diagnosis and treatment, in order to allow medical staff to focus more on professional input and develop more valuable services.
Source:ITRI-IEK, organized by SIPO (July 2018)
Smart Home Industry Status Quo
Global smart home market size
The market size and growth rate of global smart home hardware and service market
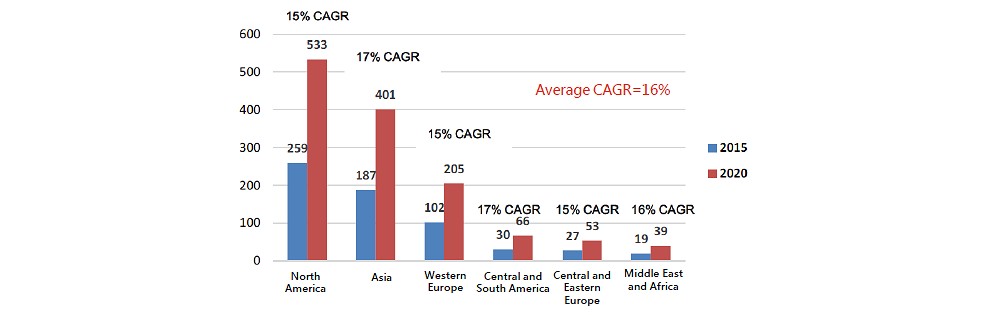
- Smart home refers to a humanized living space that provides services through integrated sensors, information appliances, and home networks, and interacts with users through multiple interfaces.
- With the global technology giants entering the smart home market, in addition to home appliance manufacturers’ announcing various types of smart terminals, the service providers have also launched service platforms and smart home control centers to drive the growth of smart home business opportunities.
- According to the estimates of Strategy Analytics, the global market for smart home hardware and services will reach $130 billion in 2020, and the compound annual growth rate (CAGR) will be 16% from 2015 to 2020. In which, the North American market still is the major market, whereas Asia and Central and South America markets are the fastest growing markets of smart homes.
Source:Strategy Analytics, ITRI-IEK, organized by SIPO (July 2018)
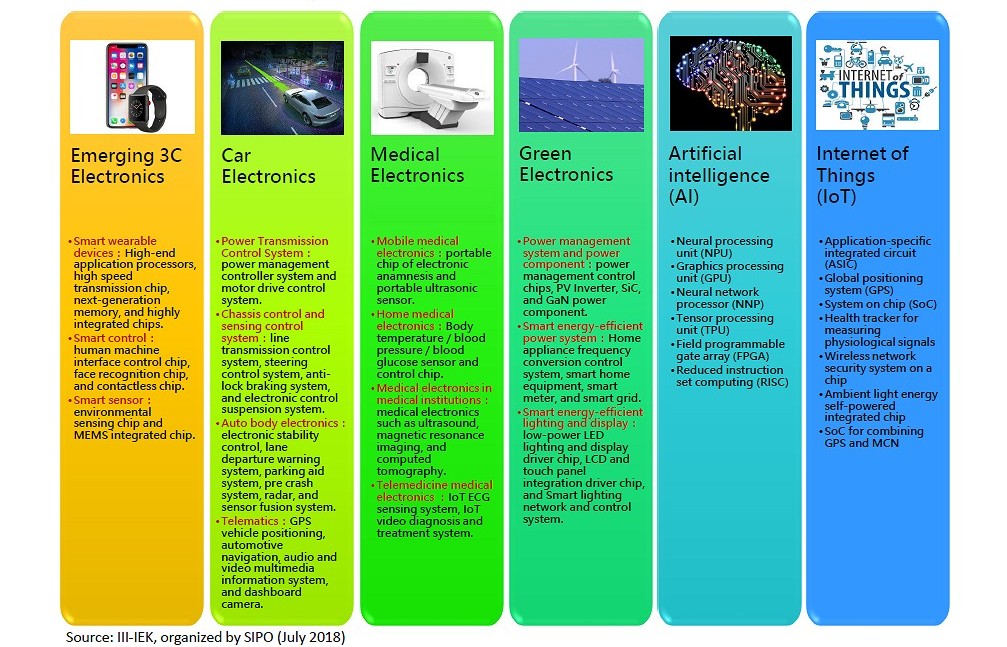
The Scope of Smart Electronics Industry